Investment-Diversification
The Impact of Diversification on Financial Performance
Research Question: Does a diversified portfolio benefit investors in terms of returns or volatility compared to the broader market? Is maximizing risk-adjusted returns or minimizing volatility more critical when constructing a portfolio?
Market Analysis
The S&P 500 is a popular index tracking the top 500 US firms by market capitalization. It is often used as a benchmark for the US stock market and economy. This analysis uses the SPDR S&P 500 ETF, commonly known as SPY, as a benchmark since it seeks to mirror the S&P 500.
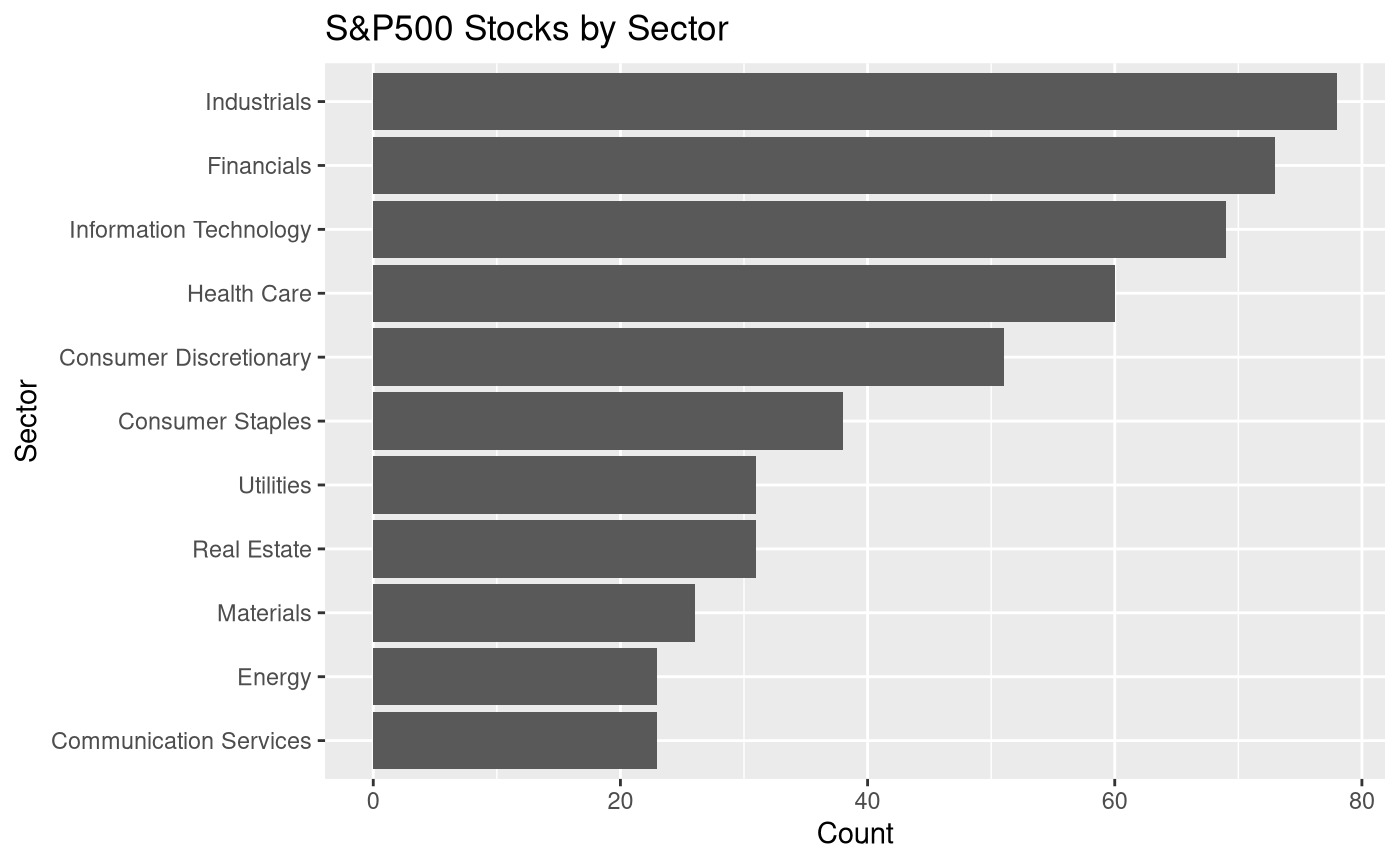
To understand the composition of the S&P 500, we used the Rvest package to scrape the list of companies in the index from the Wikipedia page (https://en.wikipedia.org/wiki/List_of_S%26P_500_companies). The image below shows the composition of the index by sector. Apart from ‘Industrials,’ we can see that the index is skewed towards service sector companies in the Financial, Information Technology, and Healthcare sectors.
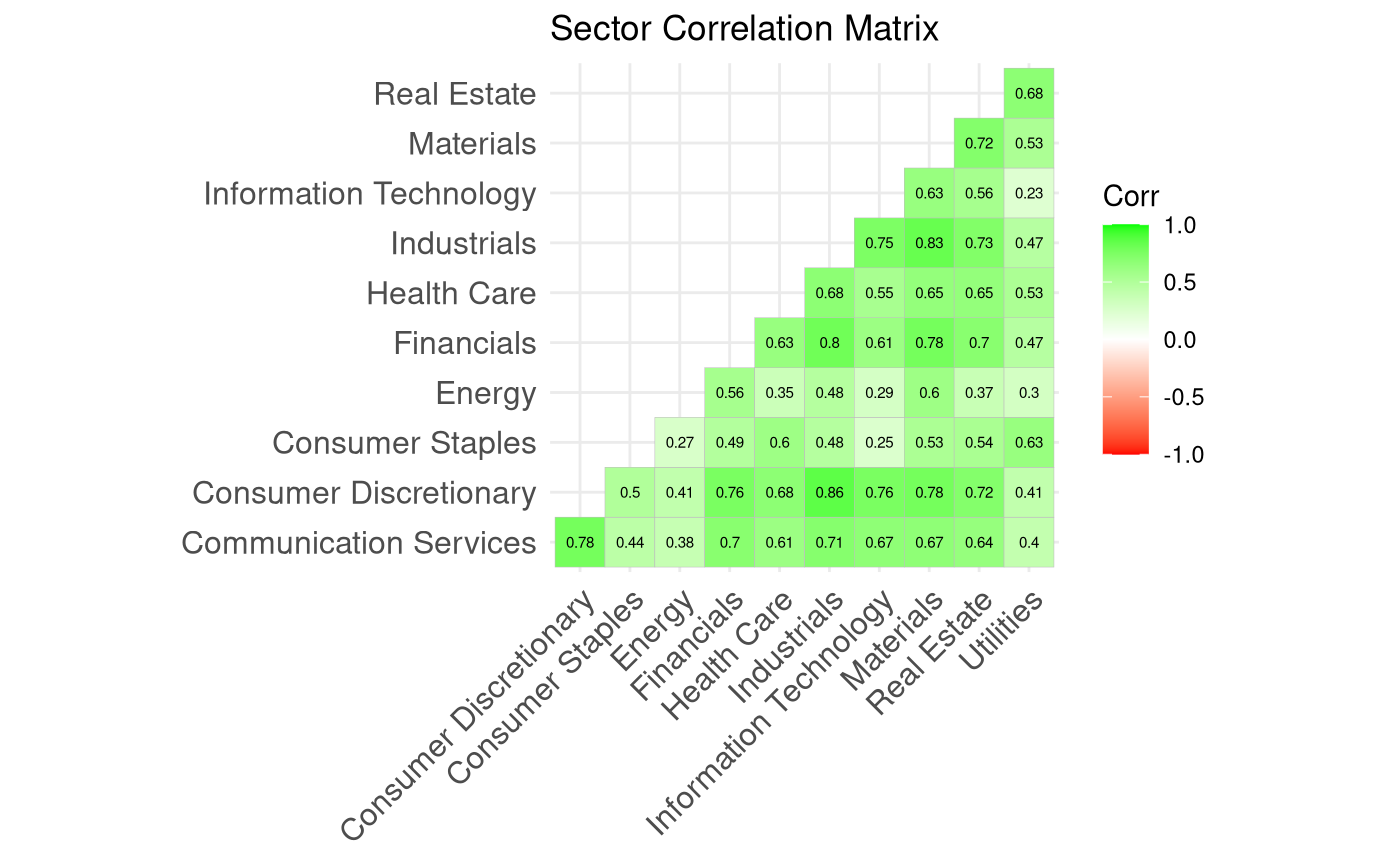
To construct a robust portfolio, we must ensure that its constituents are not highly correlated. This minimizes the portfolio’s volatility. In finance, this is called ‘diversification’ and is analogous to the saying ‘don’t keep all your eggs in one basket’; in this case, don’t heavily invest in the same or similar sectors. We pulled data from 202301 to 202405 to identify sectors with lower correlation and constructed a correlation matrix below. All sectors are positively correlated since they are exposed to the same market risk, i.e., when the US economy does well, they tend to do well. However, we can also see that some sectors have a lower correlation; for example, IT and utilities have a correlation of 0.23. Similar correlations are also observed between IT and Energy/Consumer Staples. This aligns with the popular theory that growth stocks (service sector) tend to correlate poorly with value stocks (manufacturing/mature businesses).
However, we are still exposed to market risk since all stocks fall into the equity asset class. To minimize this, it is also essential to consider other asset classes, such as bonds and commodities, since investors move money out of the market and into bonds and commodities like gold during bad market conditions. Our analysis added popular bond and commodity ETFs to our portfolio.
Portfolio Analysis
As mentioned above, diversification is key to creating a portfolio with consistent returns. In our analysis, we decided to use the following financial instruments, which can be broadly classified into three main types: equity, fixed income and commodities.
| Asset Class | Type | Name |
|---|---|---|
| Equity | Growth | Dell, Nvidia, Micron Technology, Uber, Amazon, Eli Lilly |
| Equity | Value | General Electric, Hilton, Targa Resources, JPMorgan, Amex |
| Bond | Fixed Income | Vanguard Total Bond Market ETF |
| Commodities | Commodities | iShares S&P GSCI |
Data: We pulled pricing data from 2023-2024. The first 18 months, 202301 - 202405, would act as our in-sample data, allowing us to adjust portfolio weights per our strategy. The last 6 months, 202406-202412, would be an out-of-sample test set.
Strategies: To understand the role of diversification, we explore three strategies
- An equal-weight portfolio where each stock/ETF has the same weight. For example, in a 5-instrument portfolio, each instrument would make up 20% of the total portfolio.
- Minimum Variance portfolio where weights are assigned such that the standard deviation of returns is minimized during the training period
- Maximum Sharpe portfolio where weights are adjusted to maximize the return per unit of standard deviation (Sharpe ratio) during the training period.
The weights assigned during the training period are left as they are and applied to the test period to see how each strategy performs on future data.
Training Period
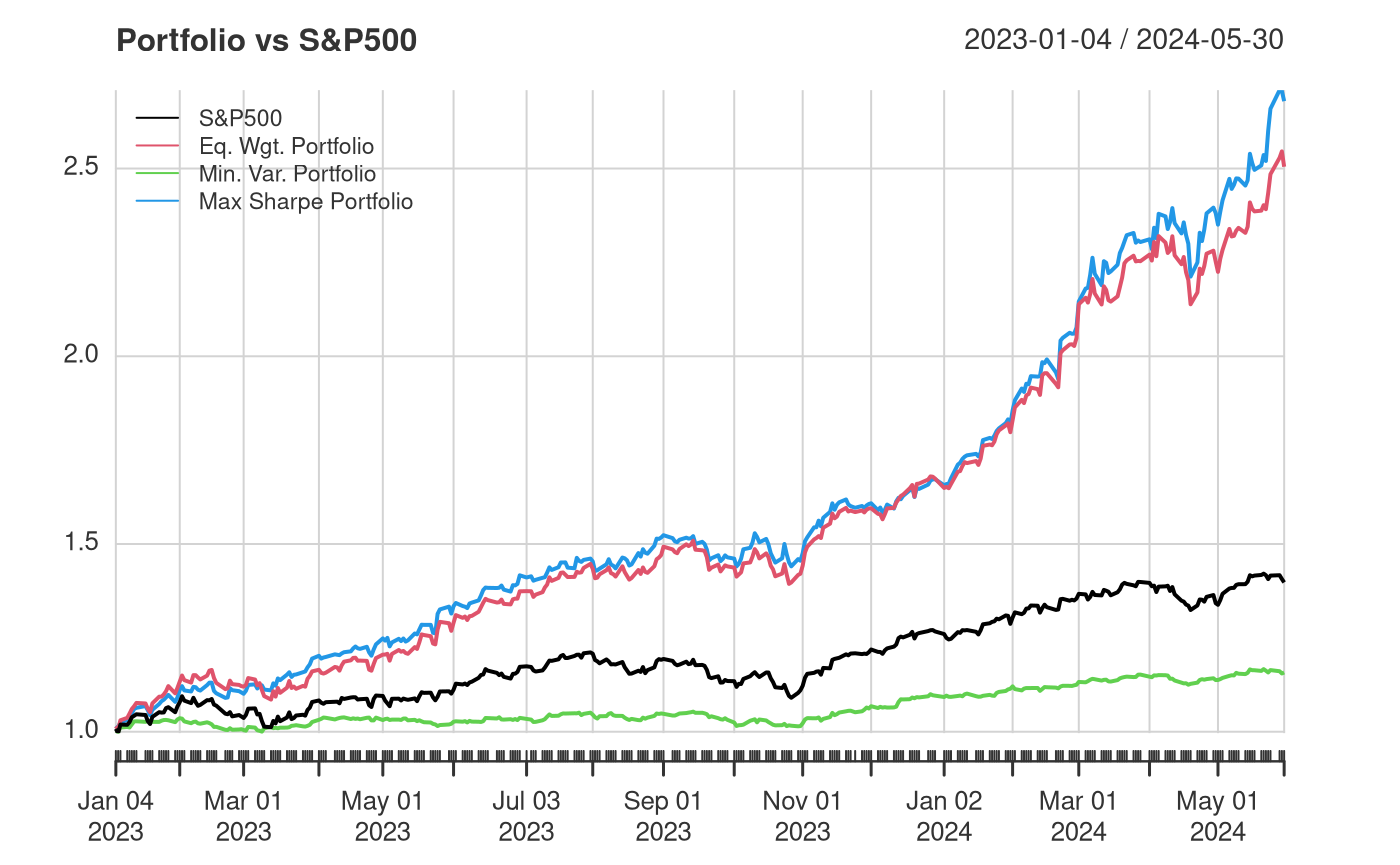
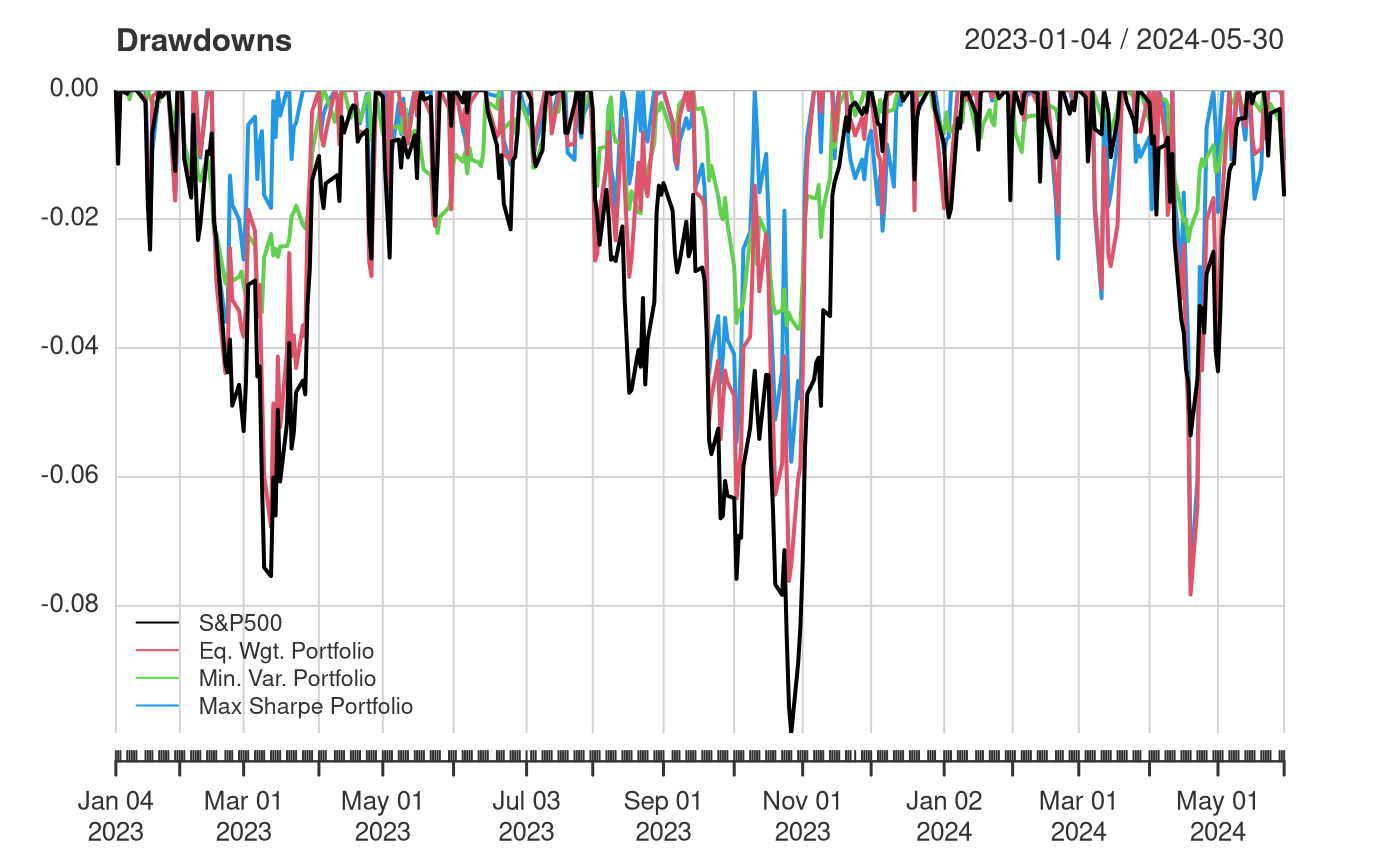
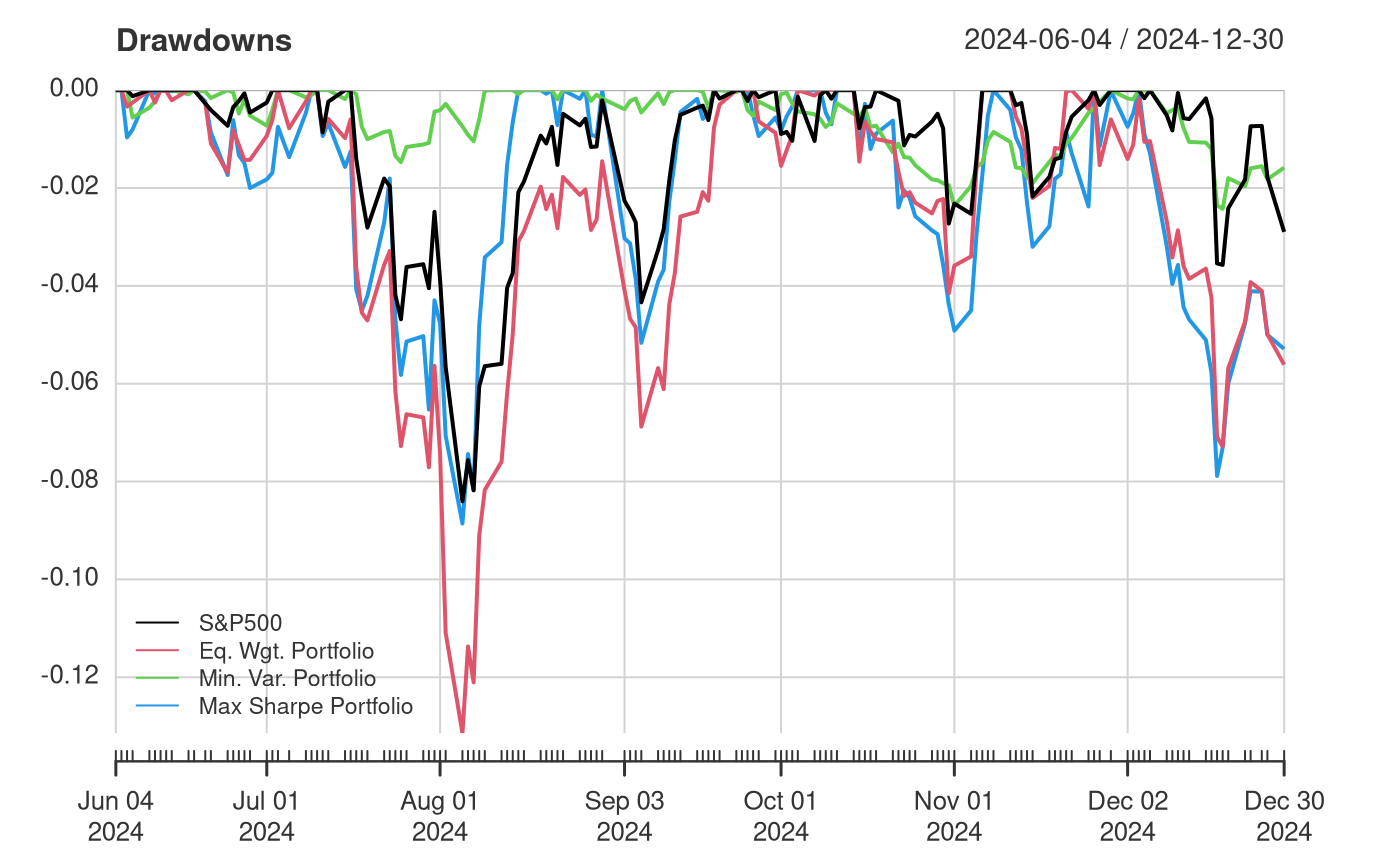
During the training period, the Equal Weight Portfolio and Max Sharpe Portfolio have the highest returns, followed by the broader S&P 500 and Minimum Variance Portfolio. The drawdown chart below shows that the S&P 500 and Equal Weight Portfolio have the most significant drawdowns or downside risk. This indicates that there is some value to diversification, whether it is to minimize volatility (Min. Var. Portfolio) or to maximize risk-adjusted return (Max. Sharpe Portfolio)
We measured the Sharpe Ratio of all three portfolios and the S&P 500 to give an objective metric to complement the above charts.
| S&P500 | Equal Weight | Minimum Variance | Maximum Sharpe | |
|---|---|---|---|---|
| Sharpe Ratio | 2.14 | 5.29 | 1.89 | 5.98 |
Unsurprisingly, the maximum Sharpe ratio portfolio had the highest value during training. But to evaluate each portfolio, it is necessary to look at its performance on future data. Thus, we simulate the portfolios using the saved weights on pricing data from 202406 to 202412.
Testing Period
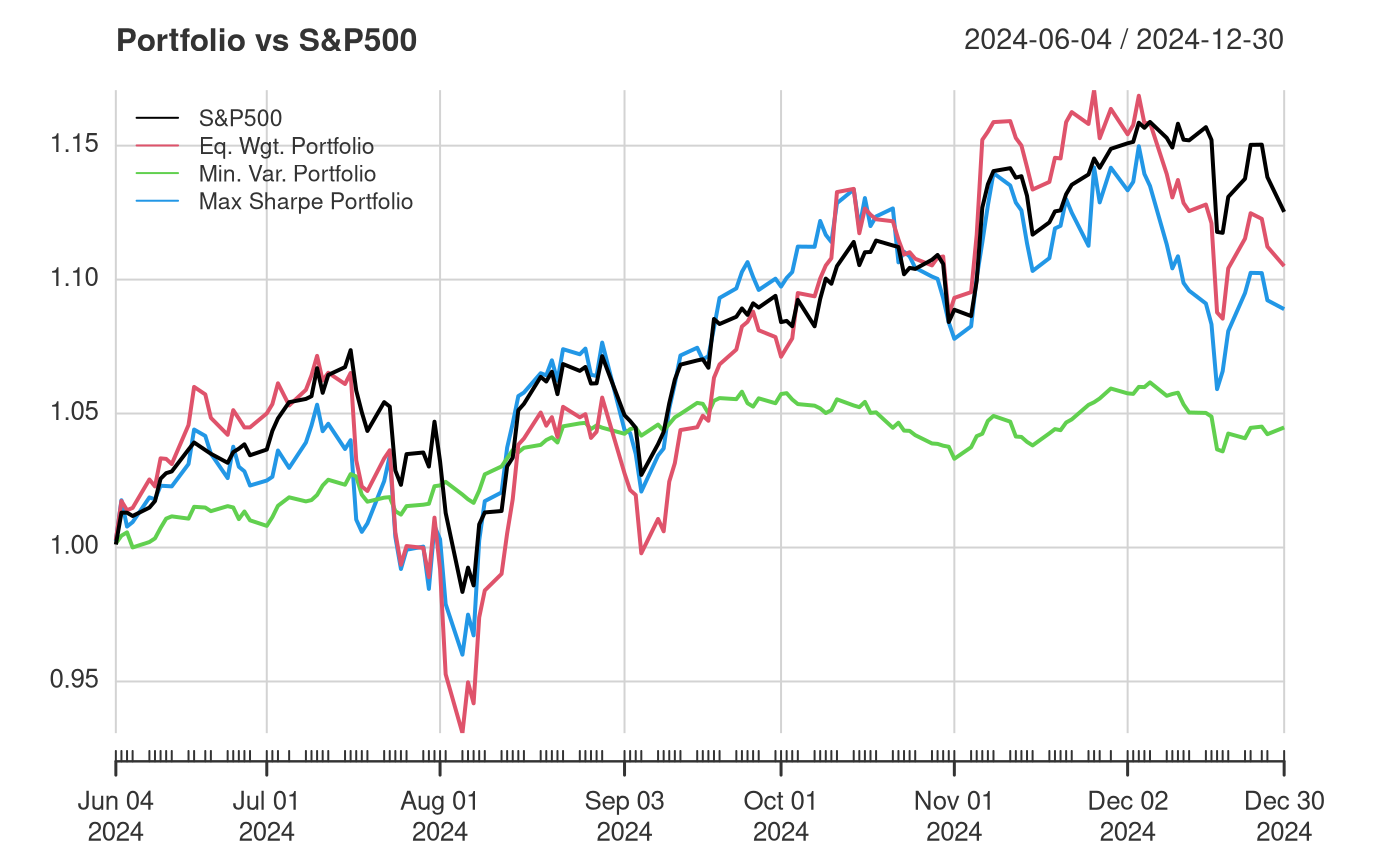
| S&P500 | Equal Weight | Minimum Variance | Maximum Sharpe | |
|---|---|---|---|---|
| Sharpe Ratio | 1.68 | 1.06 | 1.72 | 0.96 |
Evaluating the portfolios out of time gives a few interesting results
- The S&P 500 beat both the Equal Weight and Max. Sharpe portfolios while remaining less volatile.
- Unlike the other portfolios, the Minimum Variance portfolio offered consistent performance even out of the sample and did not observe significant losses in August 2024, September 2024, and December 2024.
- The Maximum Sharpe portfolio, which had the highest risk-adjusted return during the training period, performed the worst when evaluated on future data.
Conclusions
Research Question: Does a diversified portfolio benefit investors in terms of returns or volatility compared to the broader market? Is maximizing risk-adjusted returns or minimizing volatility more critical when constructing a portfolio?
From our analysis and the portfolios constructed, we can conclude that:
- For those looking to maximize returns and who can handle short-term volatility, young investors, for example, the better strategy would be to invest in the S&P 500 ETF, given its long-term performance and low cost
- For those looking for consistent returns with minimum volatility, for example, older professionals looking to retire, there is still a place for diversification/portfolio management. By spreading funds across asset classes, we see limited losses, ideal for those looking to build wealth steadily.